
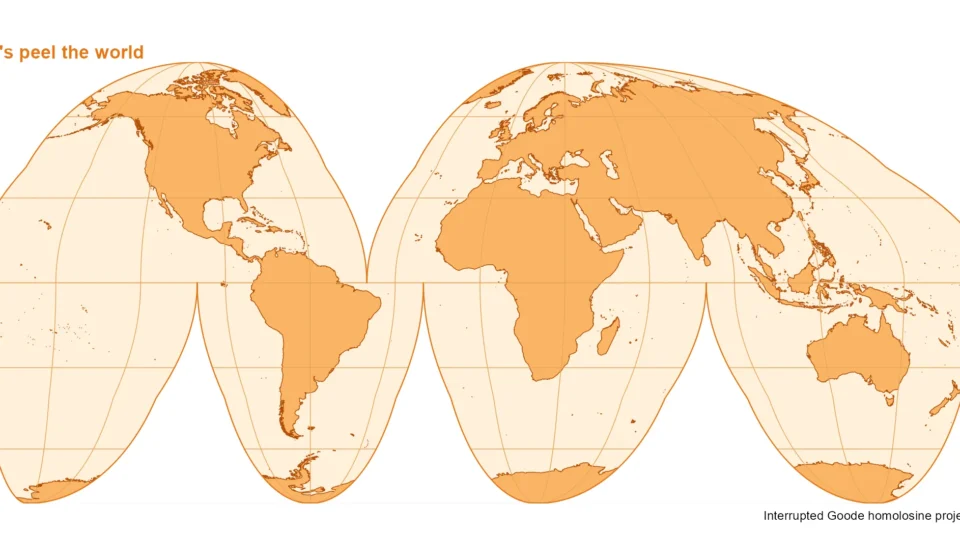
The Interrupted Goode Homolosine Projection: Visualizing Earth’s Surface with an "Orange Peel" Analogy

In a fascinating demonstration of cartographic innovation, a recent exploration into map projections has highlighted the unique visual appeal and functional advantages of the interrupted Goode homolosine projection. This projection, often likened to peeling an orange, offers a compelling way to represent the Earth’s surface while maintaining its equal-area properties, a crucial aspect for accurate geographical and statistical representation. Developed using a combination of powerful data visualization tools and geographical information systems (GIS) libraries, this approach provides a fresh perspective on how we perceive our planet.
The core concept behind the interrupted Goode homolosine projection lies in its method of dividing the world map into distinct lobes, much like the segments of an orange. This "interruption" allows for the preservation of relative areas across the globe, a significant challenge in traditional flat-map projections where distortion is often unavoidable. By strategically cutting and rearranging sections of the Earth’s surface, cartographers can minimize the stretching or compression of landmasses and oceans, leading to a more accurate depiction of their true sizes. This makes it particularly valuable for applications where area comparisons are critical, such as in population density studies, resource distribution analysis, or understanding the impact of climate change on different regions.
A Deep Dive into the Cartographic Process
The creation of this striking visual representation was meticulously executed using a suite of specialized software and programming languages, primarily R, a statistical programming language widely used in data analysis and visualization. Key libraries employed in this project include sf (Simple Features), giscoR (a package for accessing GIS data from Eurostat), and ggplot2 (a powerful data visualization package).
The process began with acquiring the Earth’s coastal outlines. This foundational step involved using the gisco_get_coastal_lines() function from the giscoR package, specifying a resolution of 10. This ensures a detailed representation of coastlines, which are essential for defining the boundaries of the projection.
The next critical phase involved defining the projection itself. The interrupted Goode homolosine projection is identified by the Coordinate Reference System (CRS) identifier "+proj=igh". This specific CRS code dictates how geographical coordinates are transformed onto a two-dimensional plane. To create the characteristic "peeled orange" effect, a specific set of latitudinal and longitudinal points were meticulously defined. This involved creating a complex series of points that would form the outline of the projection, essentially tracing the cuts and edges of the imagined "orange peel." The code snippet reveals a sophisticated construction of these points, ensuring that the outline accurately reflects the interrupted nature of the projection.
Following the creation of the primary outline, a masking technique was employed to refine the visual output. This involved defining a bounding box that encompassed the projected outline and then using a st_difference operation to subtract the outline from this box. The resulting "mask" effectively hides any geographical data that falls outside the intended projection area, ensuring that the final map has clean, defined edges, further enhancing the "peeled" appearance.
Constructing the Graticule: Meridians and Parallels Within Lobes
A crucial element in any map projection is the graticule, the network of meridians (lines of longitude) and parallels (lines of latitude) that provides a framework for spatial orientation. In the interrupted Goode homolosine projection, the graticule must be carefully constructed to avoid connecting across the "cuts" or interruptions. This requires a segmented approach to drawing these lines.
The process involved defining a series of distinct "lobes" that represent the individual segments of the projected Earth. Each lobe corresponds to a specific geographical region that is mapped independently. The code provided outlines six such lobes, each with its defined latitudinal and longitudinal boundaries.
Within each of these lobes, meridians and parallels are generated. However, the generation is constrained by the boundaries of the specific lobe. Meridians are drawn between the defined south and north limits of the lobe, and their extent is limited to the west and east boundaries. Similarly, parallels are drawn between the west and east limits, and their extent is restricted to the south and north. This careful segmenting ensures that the graticule lines do not visually bridge the gaps between the different lobes, reinforcing the interrupted nature of the projection. The seq() function in R is used to generate sequences of latitudes and longitudes, and st_linestring() is used to create these lines as geographical features.
Finally, these generated lines are transformed into the target projection CRS ("+proj=igh") using st_transform(). This ensures that the graticule aligns perfectly with the projected landmasses and oceans.
The Aesthetic Appeal: An Orange Palette for an Orange Peel
The visual appeal of the final map is significantly enhanced by the deliberate choice of colors. The projection is rendered with an "orange palette," evoking the initial analogy of a peeled orange. The landmasses are filled with a warm, vibrant orange (#F9B566), while the coastlines are delineated with a deeper, contrasting orange (#B34D08). The graticule lines are rendered in a slightly lighter shade of orange (#E8A45B), providing subtle detail without overpowering the main geographical features.
The ggplot2 library is instrumental in bringing these elements together. geom_sf() is used to draw the geographical features, including the outline, the world map itself, and the graticule. The mask object is applied to create a white background, effectively framing the projected map and further emphasizing the "peeled" effect. The final outline is drawn with a distinct color (#E87516) to provide a clear border.
The coord_sf() function plays a crucial role in setting the coordinate system for the plot, ensuring that it aligns with the interrupted Goode homolosine projection. The xlim and ylim arguments are set to match the bounding box of the projected outline, ensuring that the entire projection is visible and centered. expand = FALSE prevents any unnecessary padding around the map. The datum = NA argument removes the default datum information, which is often irrelevant for specialized projections.
Finally, theme_void() is applied to remove all non-essential plot elements like axis labels and grid lines, focusing attention solely on the map itself. Customizations to the plot background and title color further enhance the thematic coherence. The use of labs() adds a descriptive title and caption, clearly identifying the projection and its visual concept.
Background and Significance of the Goode Homolosine Projection
The interrupted Goode homolosine projection is a variation of the original Goode homolosine projection, developed by John Paul Goode in the early 20th century. Goode sought to address the inherent distortions of traditional rectangular maps, such as the Mercator projection, which significantly exaggerates areas near the poles. His goal was to create an equal-area projection that could accurately represent the size of continents and oceans.
The "homolosine" aspect refers to its design principles: it aims to be a compromise projection, balancing area accuracy with shape and distance fidelity. However, even with its improvements, the full homolosine projection can still exhibit some distortions, particularly in the representation of oceans.
The "interrupted" nature, as demonstrated in the recent visualization, was developed to mitigate these oceanic distortions. By breaking the projection into lobes and strategically cutting through the oceans, the landmasses can be depicted with greater accuracy and less visual disruption. This approach effectively sacrifices continuous ocean representation for improved land area representation. This makes it particularly suitable for thematic maps where the distribution and size of land-based phenomena are of primary interest.
Supporting Data and Applications
The equal-area property of the Goode homolosine projection makes it invaluable for a range of applications that rely on accurate spatial data. For instance:
- Population Distribution: When visualizing global population density, an equal-area projection ensures that the perceived size of a region accurately reflects its population. A highly populated area that appears small on a distorted map can lead to misinterpretations. The Goode homolosine projection prevents this, allowing for accurate visual comparisons of population concentrations. According to United Nations data, the world’s population in 2023 was approximately 8.045 billion. Visualizing this data on a non-equal-area map could significantly misrepresent the spatial distribution of these individuals.
- Resource Management: Understanding the distribution of natural resources, such as arable land, water sources, or mineral deposits, is crucial for global sustainability and economic planning. The Goode homolosine projection ensures that the area dedicated to these resources on a map is proportional to their actual extent on Earth. For example, visualizing the distribution of rainforests, which cover approximately 5.5 million square kilometers globally, requires an accurate area representation to understand their ecological significance and conservation needs.
- Climate Change Impact Studies: Mapping the extent of ice sheets, sea-level rise projections, or the distribution of climate zones necessitates an accurate representation of surface area. The Goode homolosine projection allows scientists to visually assess the relative impact of climate change on different regions without being misled by spatial distortions. For instance, the Antarctic ice sheet alone covers about 14 million square kilometers, and accurately depicting its potential melt requires a projection that respects its vast area.
- Geopolitical Analysis: When analyzing the territorial extent of nations or the distribution of political influence, area accuracy is paramount. The Goode homolosine projection provides a more equitable visual basis for such analyses, preventing certain nations from appearing disproportionately larger or smaller than they are in reality.
Chronology of Map Projection Development
The journey of map projections is a long and evolving one, marked by continuous efforts to accurately represent a spherical Earth on a flat surface:
- Ancient Origins: Early civilizations developed rudimentary mapping techniques, with notable contributions from Greek geographers like Ptolemy in the 2nd century CE, who introduced principles of latitude and longitude.
- The Age of Exploration: The 15th and 16th centuries saw a surge in mapmaking driven by maritime exploration. The Mercator projection, developed by Gerardus Mercator in 1569, became highly influential for navigation due to its property of preserving angles and direction, although it significantly distorts areas at higher latitudes.
- The Quest for Equal Area: As the limitations of Mercator became more apparent for non-navigational purposes, cartographers began developing equal-area projections. The Gall-Peters projection, developed in the late 19th century and popularized in the late 20th century, is another well-known example that prioritizes area accuracy, though it can distort shapes.
- The Goode Homolosine Era: John Paul Goode’s work in the early 20th century, culminating in the homolosine projection, represented a significant step towards a more balanced representation. His intention was to create a projection that was both equal-area and aesthetically pleasing, with fewer distortions than purely mathematical projections.
- Interrupted Projections: The concept of interrupting projections to improve the representation of specific features, particularly landmasses, gained traction. The interrupted Goode homolosine projection is a prime example of this strategy, aiming to minimize oceanic distortion by strategically dividing the map.
- Modern Digital Cartography: With the advent of GIS and computational power, cartographers now have the tools to create and manipulate a vast array of projections with unprecedented precision. The recent demonstration using R libraries exemplifies this modern approach, allowing for dynamic and visually engaging representations of complex geographical data.
Official Responses and Related Parties
While this specific visualization is a technical demonstration by an individual or group of researchers, it draws upon established cartographic principles and tools that are widely used by various institutions.
- National Mapping Agencies: Organizations like the U.S. Geological Survey (USGS) and Ordnance Survey in the UK are responsible for creating and maintaining official maps and geographical data. Their work often involves selecting and applying appropriate map projections based on the intended use of the data.
- International Organizations: Bodies such as the United Nations Geospatial Information Section and the International Cartographic Association (ICA) play roles in standardizing geospatial information and promoting best practices in cartography. The principles of equal-area representation, as exemplified by the Goode homolosine projection, are fundamental to their work in areas like global data reporting and analysis.
- Academic Researchers: Universities and research institutions worldwide are at the forefront of developing new cartographic techniques and exploring the implications of different projections. The methodology employed in this demonstration is typical of academic research aiming to enhance data visualization and understanding.
- Software Developers: Companies and open-source communities that develop GIS software and libraries, such as Esri (for ArcGIS) and the developers of R packages like
sfandggplot2, are critical enablers of modern cartography. Their tools provide the foundation for creating sophisticated map visualizations.
Broader Impact and Implications
The ability to visualize the Earth’s surface in novel ways has profound implications for how we understand our world. The interrupted Goode homolosine projection, with its "orange peel" analogy, serves as a powerful educational tool, making complex cartographic concepts more accessible to a wider audience.
- Enhanced Geographical Literacy: By presenting a more accurate visual representation of land areas, this projection can improve public understanding of global geography, potentially correcting misconceptions fostered by distorted maps.
- Improved Data Interpretation: For professionals working with geographical data, the choice of projection directly impacts the accuracy of their analysis and the conclusions they draw. The Goode homolosine projection offers a valuable alternative for applications where area is a primary concern.
- Promoting Global Equity: In a world increasingly interconnected by global challenges, accurate spatial representation is crucial. An equal-area projection can contribute to a more equitable understanding of global resource distribution, population demographics, and the impact of environmental changes, fostering a more informed and just approach to global issues.
- Artistic and Communicative Power: Beyond its scientific utility, the visually striking nature of the interrupted Goode homolosine projection demonstrates the artistic potential of cartography. Such visualizations can capture attention and communicate complex information in a memorable and engaging manner, as evidenced by the appealing "peeled orange" aesthetic.
In conclusion, the recent exploration of the interrupted Goode homolosine projection underscores the ongoing evolution of cartography. By combining advanced computational tools with a deep understanding of geographical principles, cartographers continue to refine how we visualize our planet, offering clearer, more accurate, and more insightful perspectives on the complex spatial relationships that define our world. The "peeled orange" analogy, while simple, effectively communicates the core advantage of this projection: a more faithful representation of Earth’s surface, free from the distortions that have long challenged traditional mapmaking.