
New Features in the permute Package Simplify Permutation Tests with Ordered Set Partitions and Formula-Based Design Specifications

The R package permute, a powerful tool for designing and executing permutation tests, has recently seen significant enhancements aimed at streamlining the setup process for complex analyses. Two key additions, an option for ordered set partitions and a new formula interface for specifying experimental designs, promise to make permutation testing more accessible and efficient for researchers across various disciplines. These updates, available in the development version of the package, address common challenges in defining and implementing permutation strategies, particularly when dealing with structured data or when aiming for more computationally efficient tests.
To access these new features, users are advised to install the development version of permute from the author’s R-universe repository. The installation command is as follows:
install.packages("permute", repos = c(
  "https://gavinsimpson.r-universe.dev",
  "https://cloud.r-project.org"
))
Understanding Ordered Set Partitions: Reducing Redundant Permutations
One of the most notable improvements is the introduction of ordered set partitions, designed to tackle situations where standard permutation of all observation indices leads to an unnecessarily large number of redundant test statistics. This is particularly relevant when the goal is to assess differences between distinct groups, and the order of observations within those groups, or the exact identity of observations being swapped within a group, does not alter the outcome of the test statistic.
Consider the jackal dataset included with permute, which contains mandible length measurements for male and female golden jackals. A common research question is whether there is a significant difference in mean mandible length between the sexes. When performing a permutation test for this question, one might initially consider shuffling all observation indices and reassigning them to the sex labels.
However, the default Within(type = "free") design in permute generates all possible permutations of observation indices. For a dataset with n observations, this can result in n! permutations. For the jackal dataset, which has 30 observations, the number of possible index permutations is substantial. The issue arises because many of these permutations do not represent distinct scenarios for comparing group means. Specifically, swapping two male observations or two female observations results in the same group labels and, consequently, the same test statistic if the statistic is a difference of means. These redundant permutations inflate the computational burden without contributing new information to the null distribution.
The newly introduced type = "partition" option within Plots() addresses this by calculating only the distinct ways of assigning observations to labelled groups while preserving the fixed group sizes. The term "ordered" here refers to the distinguishability of the groups (e.g., male and female are distinct roles), not to any sorting of observations within each group.
This is achieved by specifying the grouping variable using a formula. For instance, to partition the jackal data by sex, the control structure is defined as:
ctrl <- how(
  plots = Plots(strata = ~ Sex, type = "partition"),
  data = jackal
)
The formula ~ Sex instructs permute to use the Sex variable from the jackal data frame to define the partitions. When numPerms() is called with this control structure, it reveals a significantly reduced number of unique permutations compared to the total index permutations:
numPerms(nrow(jackal), control = ctrl)This reduction is based on the combinatorial formula for partitions. If there are K groups with sizes n_1, n_2, ..., n_K, such that the total number of observations is n = n_1 + n_2 + ... + n_K, the number of distinct assignments of observations to these labelled groups is given by the multinomial coefficient:
$$ fracn!n_1! n_2! cdots n_K! $$
This formula ensures that only unique assignments of observations to groups are considered, drastically improving computational efficiency for datasets with repeated group sizes. Importantly, this method works even when group sizes are unequal.
The output of shuffle() with this partition design still provides shuffled observation indices, allowing for seamless integration with existing workflows. However, the key difference is that within the returned index vector, observations that originally belonged to the same group retain their relative order. This effectively provides one representative index permutation for each distinct arrangement of group labels, thereby eliminating redundant calculations.
It is crucial to distinguish Plots(type = "partition") from Plots(type = "free"). While type = "free" permutes entire plots as intact units, type = "partition" rearranges group membership. The how() function automatically selects Within(type = "none") when a partition design is specified, as permuting within these already distinct groups would reintroduce the very redundancies that type = "partition" aims to eliminate. Consequently, other within-plot types are not compatible with the partition design.
Permutation Tests with Linear Models: An Illustrative Example
The permute package is designed to be model-agnostic, meaning it can be integrated with various statistical models and test statistics. To illustrate its application with a common statistical model, let’s perform a permutation test on the jackal data using a linear model (lm()).
First, a linear model is fitted to the data to assess the relationship between mandible length (Length) and sex (Sex):
fit <- lm(Length ~ Sex, data = jackal)
coef(fit)
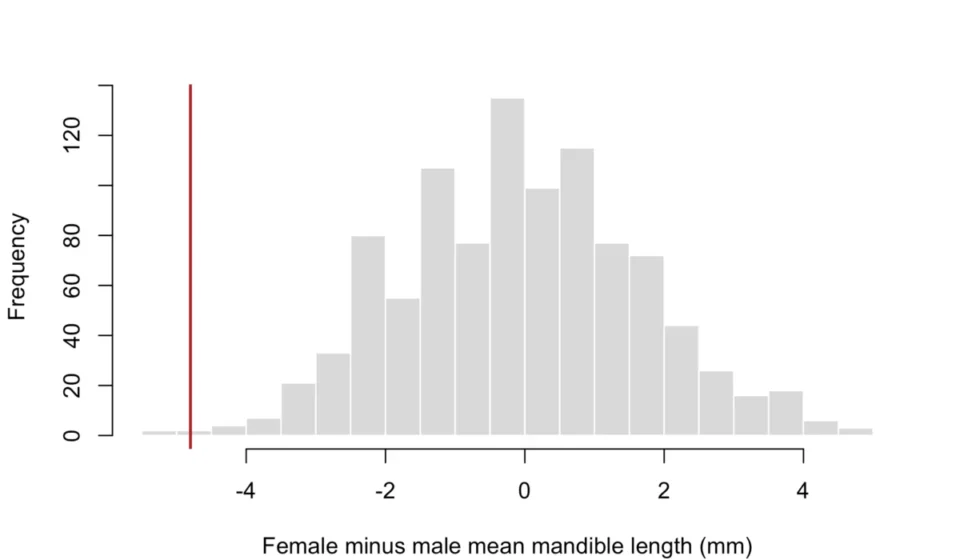
The output reveals the intercept, representing the mean mandible length for males (the reference group), and the coefficient for SexFemale, which is the difference between the female and male mean mandible lengths. In this case, the observed difference is -4.8 mm, indicating that female jackals, on average, have shorter mandibles.
For a permutation test, the lengths are kept constant, and the sex labels are shuffled. The linear model is then refitted for each shuffled assignment, and the corresponding coefficient for SexFemale is recorded. This process simulates the null hypothesis, which assumes that the sex labels are exchangeable among the observations. This assumption must be justifiable for the data and research question at hand.
The shuffleSet() function is employed to generate a manageable set of 999 permutations:
set.seed(42)
ctrl <- how(
  plots = Plots(strata = ~ Sex, type = "partition"),
  data = jackal
)
perms <- shuffleSet(nrow(jackal), nset = 999, control = ctrl)

observed <- unname(coef(fit)[2])
null <- apply(perms, 1, function(i)
  permuted <- jackal
  permuted$Sex <- jackal$Sex[i]
  unname(coef(lm(Length ~ Sex, data = permuted))[2])
)
shuffleSet() returns a matrix where each row represents a unique permutation of the observation indices. By applying the linear model fitting process to each row, we generate a distribution of the coefficient under the null hypothesis.
A histogram of these permuted coefficients, with the observed difference marked in red, provides a visual representation of the null distribution:
hist(null, breaks = "FD", main = "",
     xlab = "Female minus male mean mandible length (mm)",
     col = "grey85", border = "white")
abline(v = observed, col = "firebrick", lwd = 2)
The histogram typically shows a distribution centered around zero, reflecting the exchangeability of labels under the null hypothesis. The observed difference is then located within this distribution to assess its statistical significance.
To calculate the p-value for a two-sided test, the number of permuted coefficients that are at least as extreme as the observed difference in absolute value is counted. A small tolerance (sqrt(.Machine$double.eps)) is added to account for potential floating-point inaccuracies. The observed result is included in the count by adding one to both the numerator and the denominator, yielding a Monte Carlo estimate of the p-value:
tol <- sqrt(.Machine$double.eps)
p_value <- (1 + sum(abs(null) >= abs(observed) - tol)) /
  (nrow(perms) + 1)

c(difference_mm = observed, p_value = p_value)
The output for the jackal data typically shows a small p-value, indicating that the observed difference in mandible length between sexes is unlikely to have occurred by chance alone if there were no true difference.
For convenience, permute offers shortcut functions like shufflePartition() and shufflePartitionSet() for cases where explicit control structure definition is not needed. Additionally, allPartitions() allows for complete enumeration of all possible partitions when the dataset size permits, analogous to allPerms().
Formula Interface: Simplifying Design Specifications
The formula interface, a significant addition to permute, greatly simplifies the specification of complex experimental designs, particularly for plot strata and blocks. This feature reduces the amount of typing required and enhances the readability of the code, especially when dealing with hierarchical or multi-factor designs.
To illustrate this, let’s consider the dune meadow data from the vegan package, which includes species composition and environmental variables. Suppose the goal is to investigate the association between vegetation and soil A1 horizon thickness, while ensuring that comparisons are made only among sites sharing the same management and land use characteristics.

The experimental design can be concisely expressed using formulas:
library("vegan")
data(dune, package = "vegan")
data(dune.env, package = "vegan")

formula_ctrl <- how(
  plots = Plots(strata = ~ Management / Use),
  blocks = ~ Management,
  data = dune.env
)
In this setup:
plots = Plots(strata = ~ Management / Use)defines the strata for permutation. The formula~ Management / Usecreates a grouping factor based on the unique combinations ofManagementandUsevariables. This means permutations will occur independently within each management-use combination. By default,Plots()usestype = "none", implying that sites within these strata are shuffled freely.blocks = ~ Managementspecifies that sites must remain within their respectiveManagementcategories during permutations. This adds an extra layer of restriction, ensuring that analyses respect broader management groups.data = dune.envlinks the formula variables to the environmental data frame.
The formula ~ Management / Use effectively creates interaction terms, grouping sites by their unique combinations of management and land use. The Plots() function, when used within how(), defaults to type = "none", allowing for free shuffling of observations within these defined strata. The blocks specification further restricts permutations, ensuring that sites remain within their management categories. Although the plot restriction already implies some of this grouping, explicitly stating both plots and blocks clarifies the intended hierarchy of restrictions.
These restrictions are predicated on the assumption that sites within a specific management-use combination are exchangeable. It is important to note that this design does not account for any residual spatial autocorrelation that might exist among sites.
To verify that the specified design is respected, we can perform a shuffle and check the block and strata assignments:
set.seed(42)
i <- shuffle(nrow(dune.env), control = formula_ctrl)

all(getBlocks(formula_ctrl)[i] == getBlocks(formula_ctrl))
all(getStrata(formula_ctrl)[i] == getStrata(formula_ctrl))
Both checks return TRUE, confirming that the permuted indices i maintain the original block and strata assignments.
This design can be directly integrated into analyses, such as a Redundancy Analysis (RDA) using the vegan package. In this example, we partial out the effect of the management-use groups before testing the association with A1 horizon thickness:
env <- dune.env
env$group <- getStrata(formula_ctrl)
ord <- rda(dune ~ A1 + Condition(group), data = env)

set.seed(42)
anova(ord, permutations = formula_ctrl)
The output of the ANOVA test, using the permute control structure, provides the permutation test results. In this specific analysis, the results might indicate limited evidence for an additional association between A1 horizon thickness and vegetation, after accounting for the management-use groups.
It is noteworthy that if some strata or blocks contain only a single site, those sites cannot be permuted within that design, as there are no other observations to swap with. This highlights how the structure of the data and the chosen design directly influence the information available for statistical inference.
When constructing formulas for permute, it’s important to remember they define grouping factors, not direct model terms. For example, ~ Management + Use, ~ Management:Use, and ~ Management / Use all result in groups formed by the combinations of those variables. The / operator in permute does not introduce an additional hierarchical level beyond creating the interaction groups.
Furthermore, when Plots() is nested within how(), the data argument should be supplied to how(). If Plots() is constructed independently, it can accept its own data argument:
plot_groups <- Plots(strata = ~ Management / Use, data = dune.env)While the existing factor-based interface for defining permutations remains functional, the formula approach offers a more intuitive and readable syntax, particularly for complex grouping structures. Further details on design specifications can be found in the permute package’s documentation. The author welcomes feedback on these additions through the package’s issue tracker.
The package also introduces new helper functions for managing permutations: permutations() directly returns shuffled values, and permutator() allows for iterative processing of permutation sets. These will be explored in more detail in subsequent communications. These advancements in permute underscore a commitment to providing researchers with flexible, efficient, and user-friendly tools for robust statistical inference through permutation testing.