AI Agent Observability: Logging, Tracing, and Debugging Explained

The rapid deployment of autonomous AI agents across the enterprise landscape has introduced a critical challenge for software engineering teams: the traditional monitoring stack, built over decades to track deterministic software, is fundamentally ill-equipped to handle the probabilistic nature of large language model (LLM) workflows. In a traditional microservices architecture, a system either returns a successful "200 OK" response or throws an error that can be captured via stack traces and logs. AI agents, however, introduce a third category of failure—the "silent failure"—where a system executes perfectly from a technical standpoint but delivers a semantically incorrect, hallucinated, or redundant result.
This evolution in failure modes has necessitated the rise of AI agent observability, a specialized discipline focused on capturing every model call, tool execution, and internal reasoning step as structured data. Without these insights, developers are left to guess why an agent entered a loop or why a customer support agent issued an incorrect refund despite all systems reporting "green" on uptime dashboards. As agents move from experimental prototypes to mission-critical production tools in 2026, the implementation of structured logging, distributed tracing, and specialized debugging workflows has become the new baseline for operational excellence.
The Structural Shift: Why Traditional Monitoring Fails
The fundamental disconnect between traditional monitoring and agentic systems lies in the drivers of performance and cost. In a standard web application, latency is driven by CPU, I/O, and network speeds, while cost is generally a function of requests per second. In the world of AI agents, latency is dictated by token counts, model size, and context window management. Cost is no longer tied to the number of requests but to the volume of tokens consumed—a metric that can fluctuate wildly based on the agent’s internal "reasoning" process.
Furthermore, the non-deterministic nature of LLMs means that the same input does not reliably produce the same behavior. Factors such as temperature settings, retrieval-augmented generation (RAG) results, and tool availability can cause an agent to take entirely different paths on consecutive runs. A single "slow" request in a traditional system might indicate a database bottleneck; in an agentic system, it might indicate that the model has entered a "thought loop," consuming thousands of unnecessary tokens while attempting to solve a complex prompt.
The industry has responded by moving away from aggregate error metrics toward granular, step-by-step reconstruction. Industry researchers note that agentic systems fail in ways that appear successful: well-formed but incorrect outputs, unnecessary tool calls, or syntactically valid actions that are semantically catastrophic. This shift requires a reimagining of the "three pillars" of observability—logs, metrics, and traces—specifically for the AI era.
The Foundation of Structured Logging
Logging remains the primary tool for developers, but its application in AI agents has moved beyond free-text sentences. For an agent to be observable, every event—from tool calls to model inferences—must be recorded as structured data. This includes the specific arguments passed to a tool, the raw output returned, token consumption per step, and the duration of each individual "hop" in a multi-step chain.
A critical advancement in 2026 is the universal adoption of trace IDs tied to every log line. This practice, often automated through OpenTelemetry, allows engineers to filter through millions of logs to find the exact sequence of events for a single, specific run. In a production environment where multiple users trigger simultaneous agent runs, the ability to isolate a single execution path is the difference between resolving a bug in minutes or hours.
Engineers are also adopting more sophisticated data-handling practices. To maintain compliance and privacy, modern logging frameworks often record the length of tool outputs or truncated previews rather than full text, preventing sensitive customer data from being stored in logging backends. This "privacy-first" logging ensures that debugging value is created without creating a compliance liability.
Distributed Tracing and the Waterfall View
While logs provide point-in-time data, tracing provides the narrative. Distributed tracing for AI agents stitches individual events into a parent-child tree, showing not just that a tool was called, but why the agent’s reasoning engine decided to call it. This is largely governed by the OpenTelemetry GenAI semantic conventions, which have standardized operation types such as invoke_agent, chat, and execute_tool.
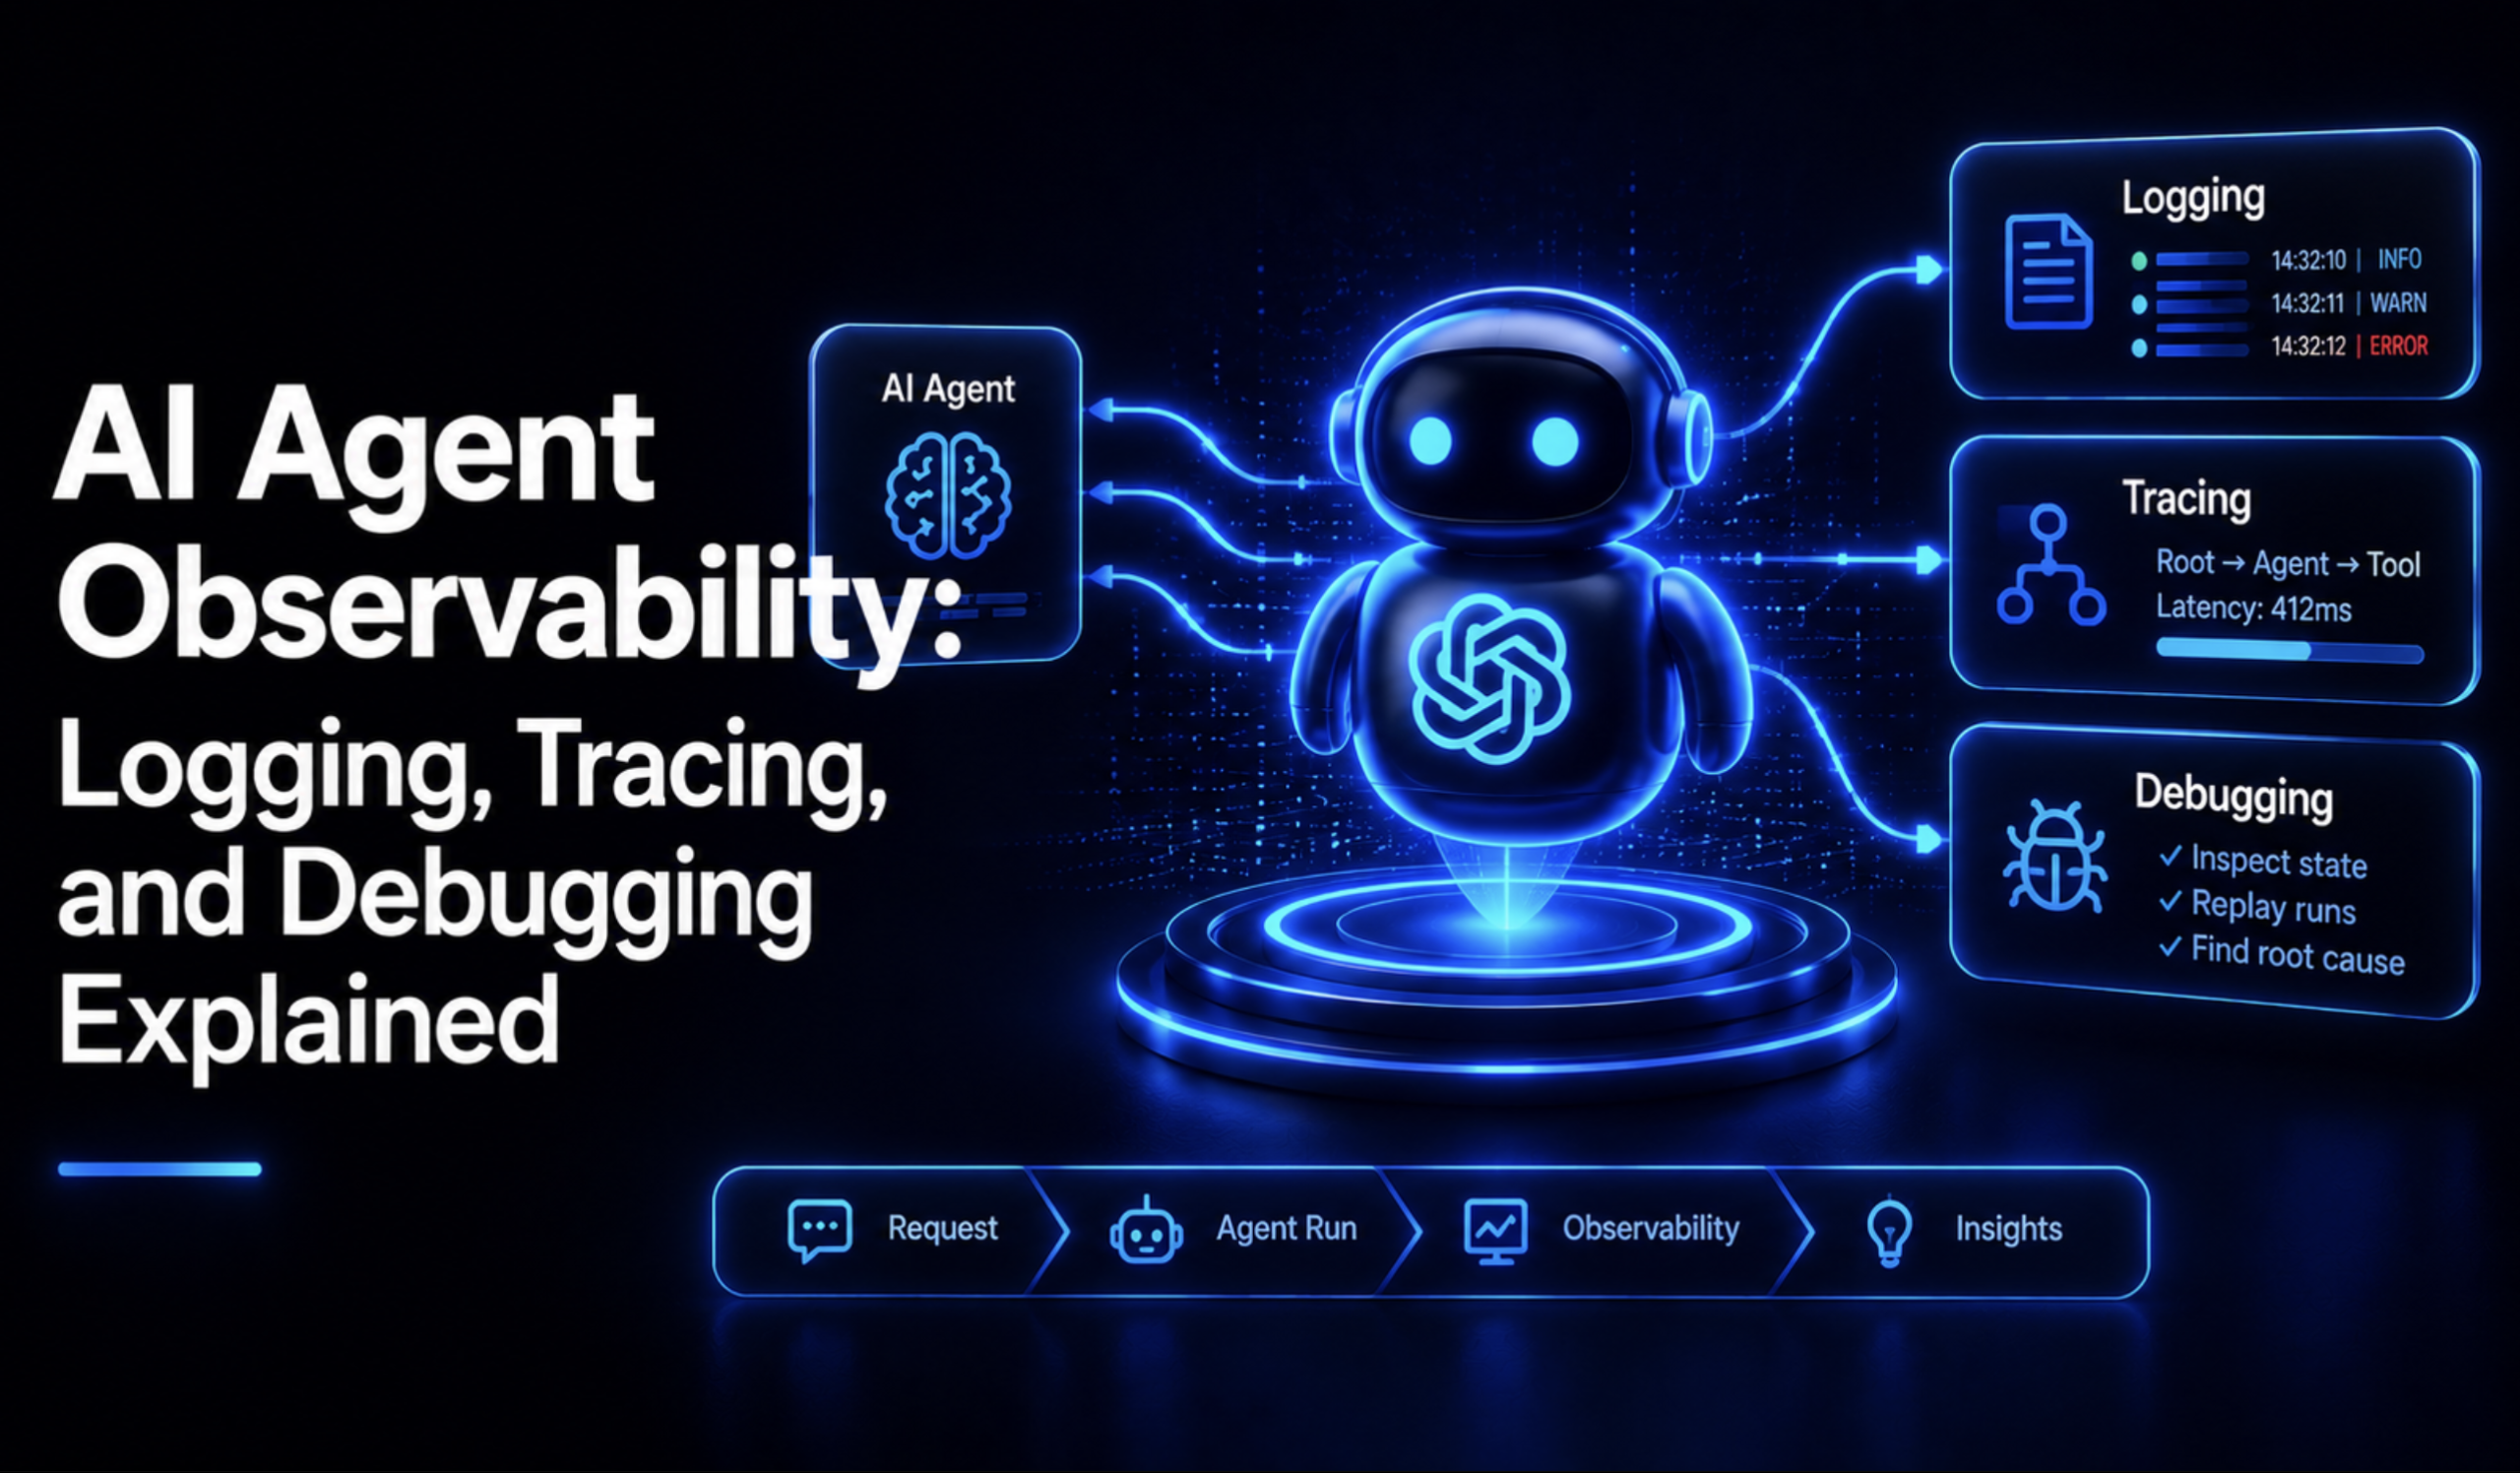
The most powerful artifact of this process is the "trace waterfall." By stacking spans based on nesting depth and horizontal duration, developers can visualize an entire agent run in a single image. This visualization immediately reveals inefficiencies that would be invisible in a standard log file. For example, a waterfall view can instantly highlight a "redundant tool call" error, where an agent calls the same lookup tool twice with slightly different arguments because it failed to parse the first response correctly.
The standardization of these traces through the Model Context Protocol (MCP) has further refined this process. As of the latest specifications in early 2026, MCP attributes like session IDs and protocol versions are now layered directly onto existing tool-execution spans. This prevents "trace bloat"—a common issue in earlier AI monitoring where protocol-level noise made it difficult to see the actual logic of the agent.
The Token Economy: Metrics and Cost Tracking
In 2026, the financial health of an AI-driven enterprise is tied directly to token usage metrics. Leading teams now track gen_ai.client.token.usage and gen_ai.client.operation.duration as their primary health indicators. However, the nuance lies in the breakdown: recording input and output tokens as separate counters is essential because of the asymmetrical pricing models of most model providers.
By monitoring the input-to-output token ratio, teams can identify "system prompt bloat." If an agent is consistently consuming 10 input tokens for every 1 output token, it often indicates that the developer-provided instructions have become too large, leading to unnecessary costs and increased latency. Modern observability platforms now provide automated alerts for "runaway loops," where an agent enters an infinite cycle of tool calls, a failure mode that can exhaust an entire month’s API budget in a matter of minutes if left unmonitored.
Market Context and the Tooling Landscape
The market for AI observability has seen significant consolidation and investment as of 2026, reflecting the high stakes of agentic reliability. A major milestone occurred in January 2026 when ClickHouse acquired Langfuse, a popular open-source observability platform, signaling a move toward integrating deep trace data with high-performance analytical databases. Similarly, Braintrust secured a $80 million Series B round in February 2026, underscoring the demand for managed SDKs that bundle evaluation and tracing.
The current landscape is divided into three primary deployment models:
- Self-hosted platforms (e.g., Langfuse, Arize Phoenix): Favored by healthcare and financial sectors for data residency and cost control.
- Managed SDKs (e.g., LangSmith, Braintrust): Chosen by startups and agile teams for rapid deployment and built-in evaluation tools.
- Proxy Gateways (e.g., Helicone): Used by teams working across hundreds of different models who require a centralized routing and cost-tracking layer.
Advanced Debugging: Time-Travel and Natural Language Queries
The pinnacle of current observability practice involves two emerging techniques: "time-travel" debugging and natural language trace querying. Time-travel debugging, popularized by platforms like AgentOps, allows an engineer to "replay" an agent session from a specific point in the past. If an agent failed at step 15 of a 20-step process, the developer can restore the exact state of the agent at step 14 and test different prompts or tool outputs to see how the behavior changes.
Natural language trace querying represents a shift in how engineers interact with data. Rather than manually clicking through waterfall bars, developers can now ask the observability platform, "Why did the agent call the refund tool twice?" The system analyzes the trace data, compares it to the system prompt, and provides a generated explanation. This reduces the cognitive load on developers and accelerates the "mean time to resolution" (MTTR) for complex AI failures.
Analysis of Implications
The shift toward deep observability for AI agents represents more than just a technical upgrade; it is a fundamental change in the relationship between humans and software. As we move toward a world where "code" is often a natural language prompt and "execution" is a probabilistic inference, the transparency provided by logging and tracing is the only way to maintain accountability.
For organizations, the implication is clear: an unmonitored agent is a liability. The risks of hallucination, prompt injection, and runaway costs are too high to treat AI as a "black box." By adopting the structured frameworks of OpenTelemetry and the specialized tools of the AgentOps movement, enterprises can finally treat AI agents with the same rigor, predictability, and safety as the legacy systems they are beginning to augment. The transition from "testing prompts" to "observing systems" is the defining characteristic of the professional AI engineer in 2026.