
Unveiling Historical Conflict: A Novel Approach to Visualizing UK Battles Through Space-Filling Curves

A recent exploration into data dimensionality reduction has yielded a fascinating new perspective on the historical landscape of conflict within the United Kingdom. By leveraging a comprehensive dataset of approximately 550 historical battles, meticulously extracted from Wikidata using SPARQL queries, researchers have employed a sophisticated visualization technique that promises to bring clarity to patterns previously obscured. This innovative method, which maps two-dimensional geographical data onto a one-dimensional space-filling curve, offers a compelling alternative to traditional mapping, revealing geographical and temporal correlations with unprecedented detail.
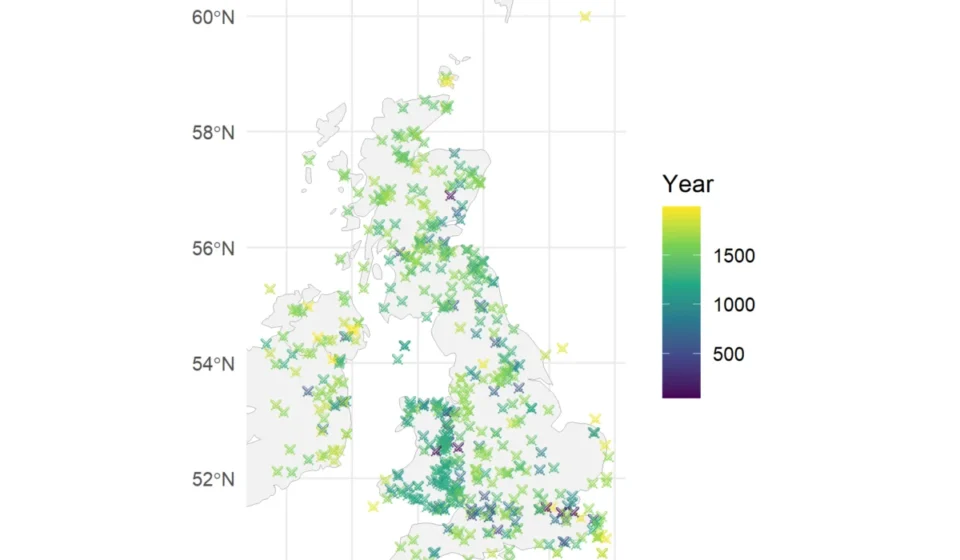
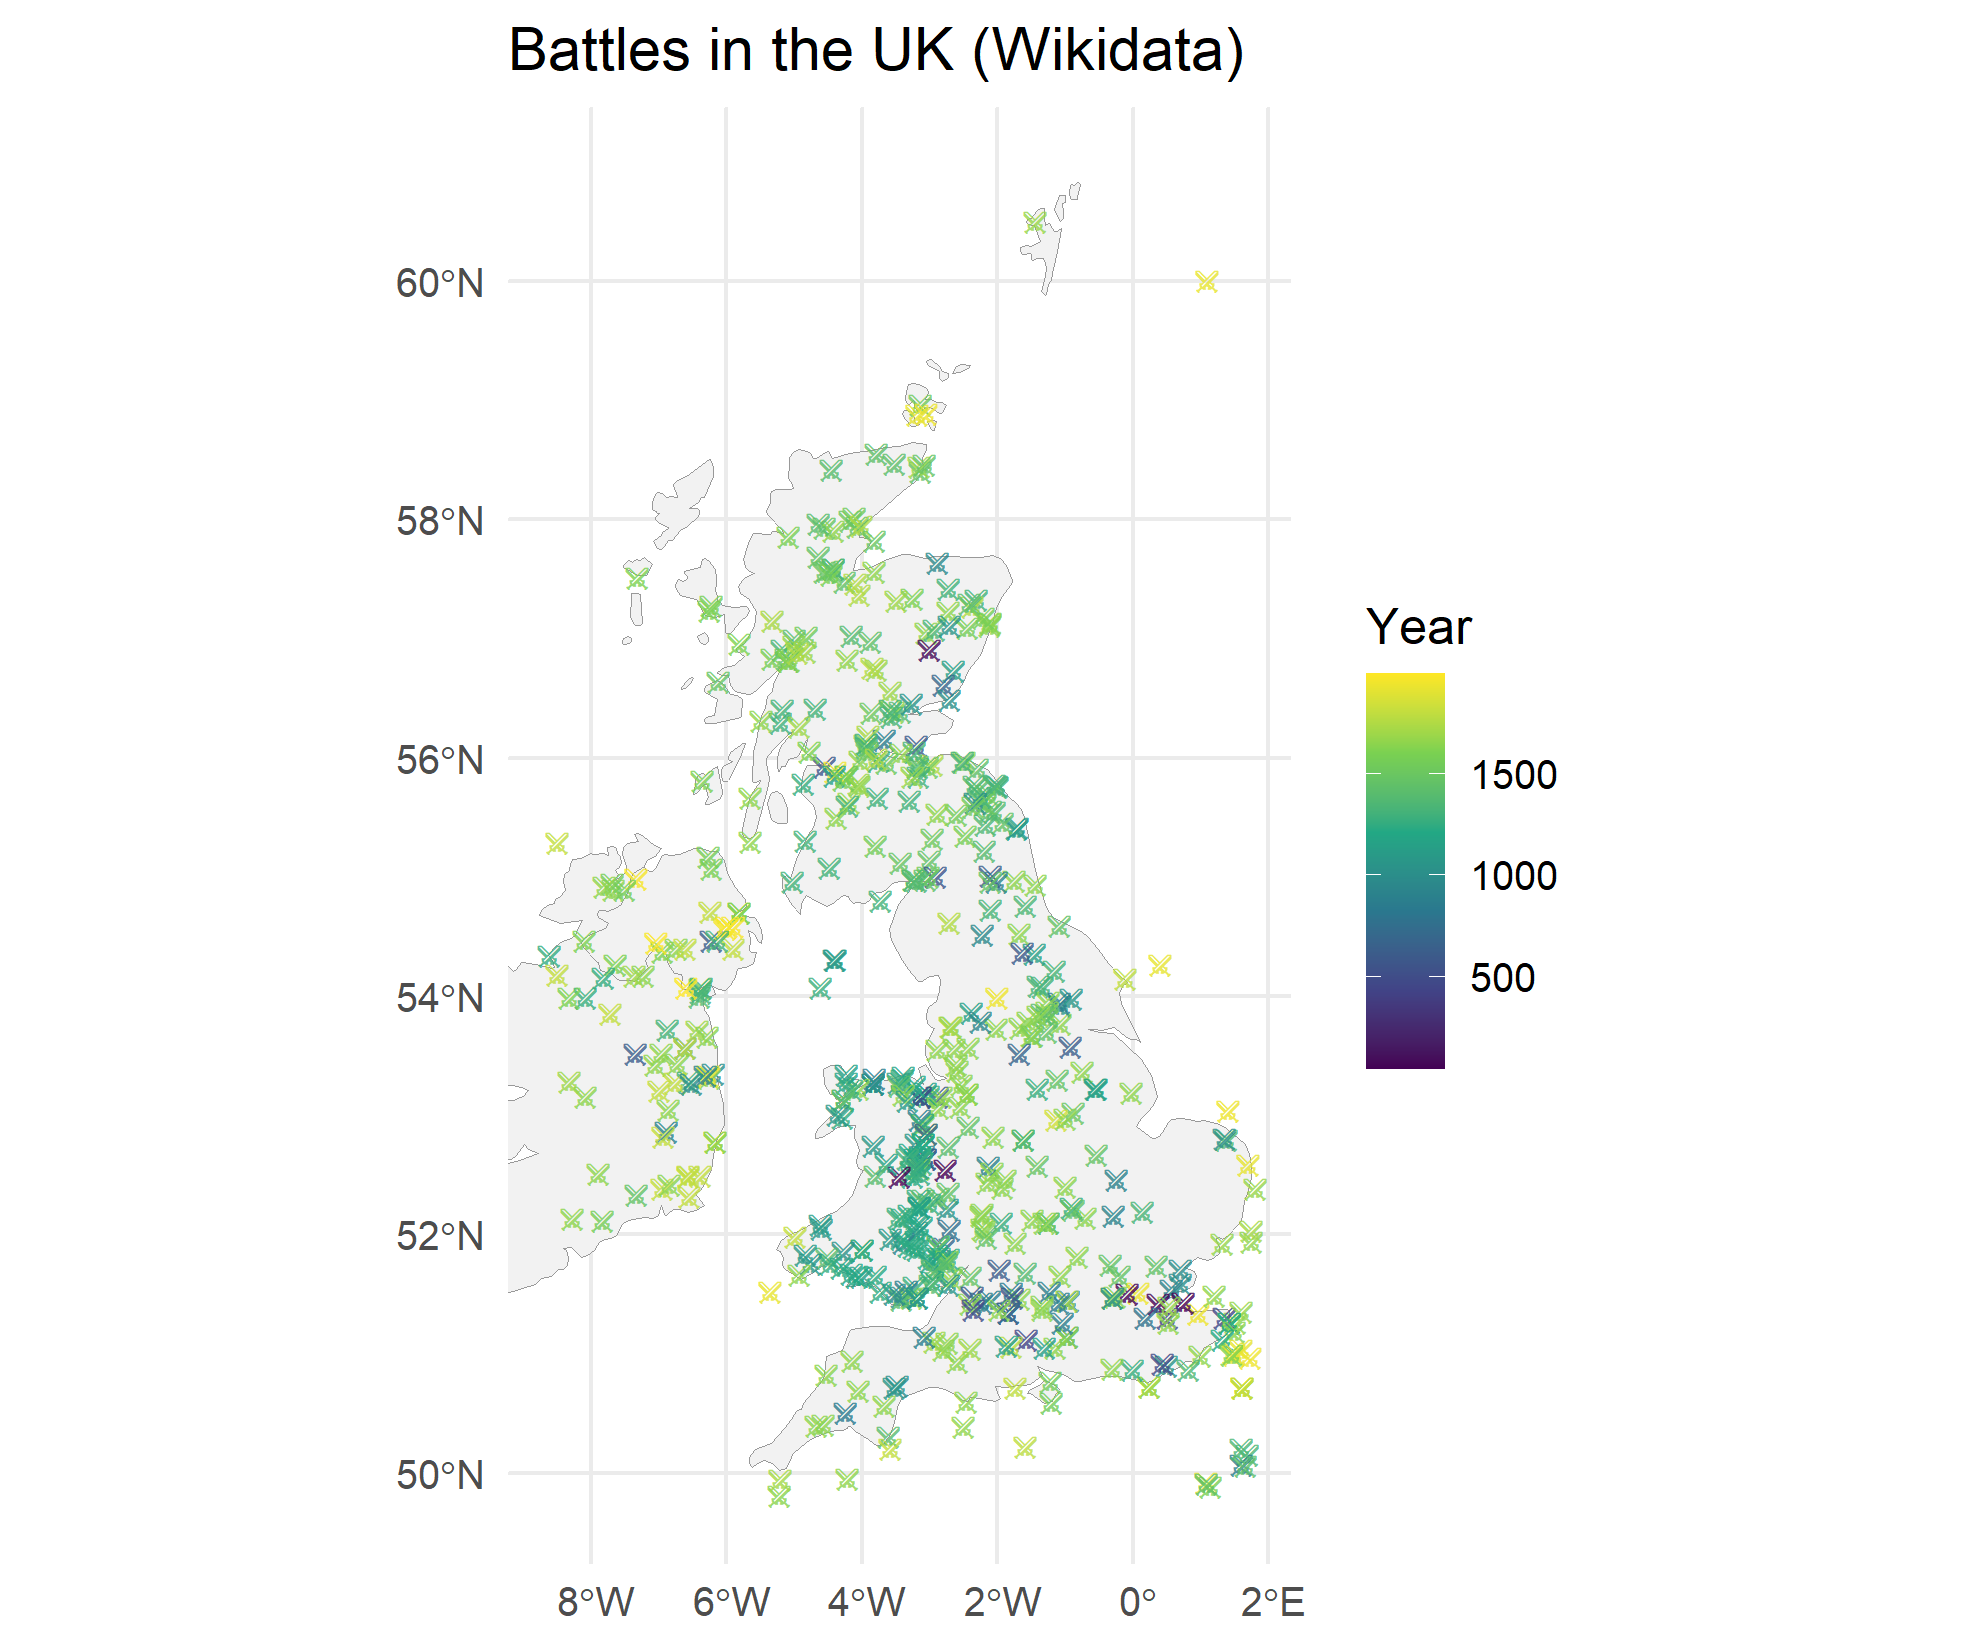
The raw data, when initially plotted on a geographical map, hints at areas of intense historical contention. The distribution of crossed swords symbols, representing battle locations, suggests regions prone to prolonged conflict, such as the borderlands of medieval Wales. However, the inherent limitations of a purely geographical representation often mask the temporal dimension of these events, leaving complex historical narratives fragmented. This new visualization technique aims to bridge that gap, transforming spatial coordinates into a sequential representation that can be analyzed alongside chronological data.
The Power of Space-Filling Curves
At the heart of this innovative visualization lies the concept of a space-filling curve. In essence, a space-filling curve is a continuous fractal curve that, as it extends infinitely, passes through every point in a given space. For this project, the Hilbert curve, a well-known example of such a curve, was utilized. The Hilbert curve is particularly adept at mapping multi-dimensional data onto a single dimension while attempting to preserve the locality of the data. This means that points that are close together in the original two-dimensional space are likely to remain relatively close together when mapped onto the one-dimensional curve.
The construction of a Hilbert curve typically involves recursive algorithms. A basic implementation can generate a $2^n times 2^n$ matrix, where each cell is assigned a unique number corresponding to its position along the curve. As the value of ‘n’ increases, the complexity and resolution of the curve grow, allowing for a more granular representation of the data. The visualization employed a $64 times 64$ grid, providing a high level of detail for mapping the battle locations.
Mapping Historical Battles: From Geography to Chronology
The dataset, comprising over 550 historical battles, was meticulously curated from Wikidata, a collaborative, multilingual, secondary database that supports Wikipedia and other Wikimedia projects. The extraction process involved a SPARQL query, a query language used to retrieve information from Wikidata. This ensured a broad and relatively accurate collection of conflict events across the UK. The geographical boundaries for the analysis were set between -6 and 1.8 degrees longitude and 49.8 and 58 degrees latitude, encompassing significant portions of England, Wales, and Scotland, while largely excluding Ireland.
The visualization process involved plotting the geographical coordinates (longitude and latitude) of each battle onto the Hilbert curve. This transformation effectively converts the two-dimensional spatial information into a one-dimensional sequence. The resulting plot, a departure from traditional maps, displays battles as points along a complex, winding line. This unique representation allows for the identification of patterns that are less apparent on a standard geographical map.
Uncovering Hidden Narratives in the Data
The transformed visualization reveals striking patterns that offer new insights into the history of conflict in the UK:

Geographical Clusters and Regional Conflicts
The visualization clearly delineates geographical clusters of battles. From left to right, these clusters appear to correspond to the historical regions of Wales, Scotland, and England. This visual clustering reinforces our understanding of the historical prevalence of conflict in these areas. The border regions, particularly between England and Wales, are visually dense, suggesting a history of frequent skirmishes and invasions. Similarly, the Scottish Highlands and the border regions with England are prominent areas of historical contention.
Temporal Dimensions of Conflict
One of the most significant advantages of this space-filling curve visualization is its ability to represent temporal relationships. Periods of intense, localized conflict are depicted as vertical columns of points. This suggests prolonged campaigns or sieges within a specific geographical area over an extended period. Conversely, widespread conflicts that spanned larger geographical areas manifest as horizontal lines of points. This pattern indicates simultaneous or closely timed engagements across a broader region, reflecting the reach and intensity of larger-scale military operations.
Illuminating Key Historical Eras
The visualization excels at highlighting specific periods of intense conflict, allowing for a more nuanced understanding of their geographical and temporal scope.
-
The English Civil War (1642-1651): A prominent horizontal band of yellow-highlighted points unmistakably represents the English Civil War. This visualization clearly shows the widespread nature of this conflict, which engulfed much of England and Wales. The distribution of these points reflects the movement of armies and the numerous engagements that characterized this turbulent period. This war, a struggle between Parliamentarians and Royalists, fundamentally reshaped England’s political landscape, leading to the execution of King Charles I and a brief period of republican rule.

-
The Jacobite Rebellions (Late 17th to Mid-18th Century): The purple-highlighted points signify the Jacobite Rebellions. These uprisings, primarily aimed at restoring the Stuart monarchy to the thrones of England, Scotland, and Ireland, are visibly concentrated in Scotland. The pattern here illustrates the strategic importance of the Highlands and the significant resistance encountered by the Hanoverian government in these regions. The last major Jacobite uprising, the 1745 rebellion, famously culminated at the Battle of Culloden, a pivotal event in Scottish history.
-
The Conquest of Wales (11th-13th Centuries): A long, turquoise-highlighted sequence of points represents the protracted English Conquest of Wales. The visual representation as a drawn-out "line" underscores the incremental nature of this historical process, involving numerous campaigns and battles over centuries. This conquest ultimately led to the incorporation of Wales into the Kingdom of England.
-
20th Century Conflicts: Intriguingly, a peculiar row of points near London, highlighted in green, represents battles from the 20th century. These include engagements associated with both World War I and World War II, such as the Battle of Britain and various naval skirmishes. The proximity of these points to London, despite their temporal distance from many other historical battles, highlights the city’s strategic importance and the aerial and naval dimensions of modern warfare.
Broader Implications and Future Directions
The application of space-filling curves to historical data presents a powerful new tool for historians, data scientists, and researchers. This technique moves beyond simple geographical plotting to offer a more integrated view of temporal and spatial dimensions of historical events. The ability to identify clusters, sequences, and widespread patterns can lead to new hypotheses and a deeper understanding of the causes and consequences of historical conflicts.

The implications of this visualization extend beyond military history. Similar techniques could be applied to other historical datasets, such as outbreaks of disease, migration patterns, or trade routes, to uncover hidden correlations and narratives.
However, this innovative approach also raises further questions:
- Origin of the Technique: The exact origin of using space-filling curves for dimension reduction in historical data analysis remains an open question. Understanding its genesis could provide further context and potential refinements.
- Optimization of Curve Choice: The effectiveness of the visualization is dependent on the choice of space-filling curve. Research into whether there exists an "optimal" curve for specific types of historical data, one that minimizes distortion and maximizes the preservation of meaningful relationships, would be highly valuable.
- Data Interpretation Nuances: While the visualization reveals patterns, careful interpretation is still required. The "closeness" on the Hilbert curve is a mathematical approximation and may not perfectly reflect geographical proximity in all instances. Understanding the inherent distortions introduced by the mapping process is crucial for accurate analysis.
In conclusion, the application of Hilbert curves to visualize historical battle data from the UK represents a significant advancement in data visualization. By transforming complex geographical and temporal information into a coherent, sequential representation, this method unlocks new avenues for historical inquiry and offers a compelling narrative of conflict across the British Isles. The clarity with which major historical events, such as the English Civil War and the Jacobite Rebellions, are depicted, alongside less obvious but equally significant patterns, underscores the power of this novel approach. As researchers continue to explore and refine these techniques, we can anticipate a richer and more nuanced understanding of our shared past.