
Revisiting the Crude Oil Price Impact: A Data Visualization Deep Dive

The ongoing geopolitical tensions, particularly the heightened conflict between the United States and Iran, have cast a long shadow over global crude oil markets. While the immediate impacts on supply and price are a constant focus, understanding the underlying economic mechanisms at play is crucial for accurate forecasting and informed policy decisions. A recent analysis, initially presented by Robin J Brooks of the Brookings Institution and attributed to Haver Analytics, attempts to illustrate these theoretical impacts. However, the original visualization, while conceptually important, has proven challenging to interpret. This article revisits that analysis, offering a more accessible and data-rich visualization to better understand the intricate relationship between supply disruptions and crude oil price fluctuations.
The Core Economic Principle: Price Elasticity of Demand
At the heart of the analysis lies the concept of price elasticity of demand for crude oil. This fundamental economic principle quantifies how sensitive the quantity of oil demanded is to changes in its price. Unlike the often-simplified assumption of a perfectly inelastic demand (where price changes have no impact on quantity demanded), crude oil exhibits a degree of elasticity. Estimates for the short-term price elasticity of demand for crude oil typically range between -0.1 and -0.2. This means that a 1% increase in price could lead to a 0.1% to 0.2% decrease in the quantity of oil demanded. Conversely, and crucially for this analysis, a 0.1% decrease in supply, if demand remains relatively stable, could theoretically lead to a 1% to 2% increase in price, assuming a linear elasticity model.
The US-Iran Conflict and Oil Supply Dynamics
The US-Iran conflict has presented a complex scenario for global oil markets. At its peak, disruptions stemming from the conflict have, at various points, impacted a significant portion of global oil supply. While precise figures are difficult to ascertain and fluctuate with evolving geopolitical events, analyses suggest that at its most acute phase, the conflict may have removed or threatened to remove between 10% and 20% of global oil supply from the market. While the immediate reduction in oil flowing to the market may have lessened at the time of this analysis’s original drafting, the inherent volatility and potential for future escalations mean that the risk premium and supply concerns remain.
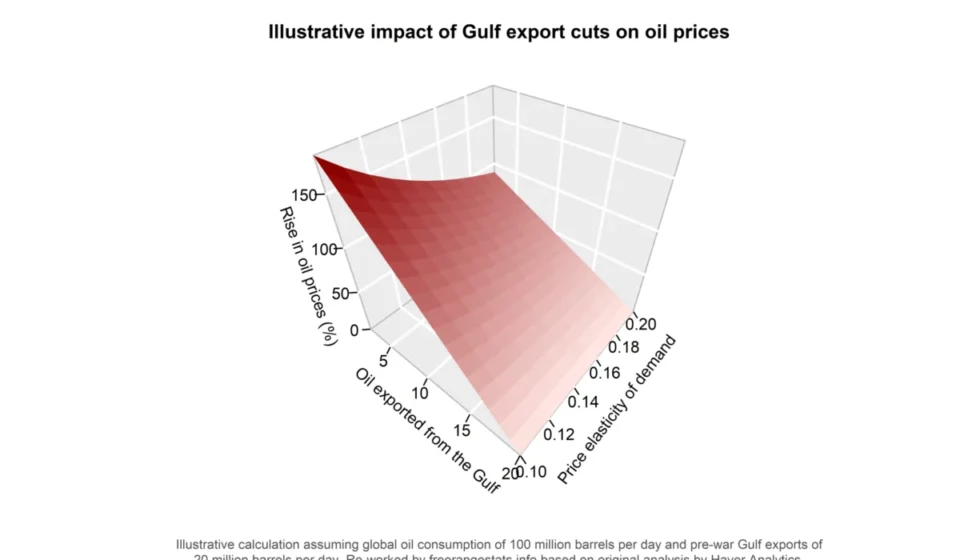
The theoretical impact of such supply shocks, when applied to the price elasticity of demand, can be substantial. For instance, a 10% reduction in global oil supply, under a price elasticity of -0.1, could theoretically result in a 100% increase in oil prices (i.e., doubling the price). With a price elasticity of -0.2, the same 10% supply cut could lead to approximately a 50% price increase. This range of potential outcomes underscores the significance of the original diagram’s intent.
Challenges with the Original Visualization
The original diagram, attributed to Haver Analytics, attempts to illustrate this complex interplay using a 3-dimensional perspective plot. This format aims to represent three variables simultaneously: the amount of oil successfully exported from the Gulf region, the resulting impact on crude oil prices, and the uncertain parameter of short-term price elasticity of demand. While this approach seeks to capture the multidimensional nature of the problem, 3D perspective plots often suffer from inherent readability issues. It can be difficult for viewers to accurately gauge values across the three axes and discern clear trends or tendencies, especially when compared to more conventional 2D representations like scatter plots or line graphs. The author of the original blog post found this visualization particularly difficult to interpret, necessitating a re-examination.
A More Accessible Approach: Data Visualization Improvements
To address the limitations of the original visualization, several alternative approaches were explored, focusing on clarity and the ability to convey complex relationships more effectively.
Improvement 1: The Heatmap Approach
One common method to improve upon 3D perspective plots is to transform the data into a heatmap. In this format, the third variable is represented not by a vertical axis but by the color intensity or hue within a 2D grid. This approach utilizes the same underlying data—a matrix of values defined by two primary variables and a third dependent variable—but maps the dependent variable to a color scale.
The heatmap version of the analysis presents a clear grid where the x-axis represents the volume of oil exported from the Gulf, and the y-axis denotes the price elasticity of demand. The color of each cell within this grid indicates the projected percentage increase in crude oil prices. This visualization offers a significant improvement in readability by allowing viewers to directly compare price impacts across different export volumes and elasticity assumptions. Numerical values are often overlaid for precise reading.
While this heatmap provides a more direct comparison of price impacts, it can, in some instances, verge on resembling a data table, potentially diminishing the visual impact of a dynamic relationship. However, it serves as a valuable intermediate step in enhancing the interpretability of the original data.
Improvement 2: The Line Plot as the Optimal Solution
The most effective visualization, according to the analysis, is a well-structured line plot. This approach prioritizes the most crucial relationships for the audience: the direct correlation between the volume of oil successfully exported from the Gulf and the resulting change in world crude oil prices. By placing these two key variables on the x and y axes, respectively, the inherent trend and the nature of their interaction become immediately apparent.
The uncertainty surrounding the price elasticity of demand is then elegantly represented by a fan of color-coded lines. Each line signifies a different plausible value for the price elasticity, illustrating the range of potential price impacts based on this critical, yet variable, economic parameter. This "fan" of lines effectively communicates the sensitivity of the price outcome to this specific assumption.
Enhanced Comprehensibility and Data Integration
A significant advantage of the line plot is its capacity for further data integration. In this improved visualization, a secondary y-axis is introduced. This secondary axis translates the percentage price increases into an implied dollar value per barrel. Using a pre-war crude oil price of approximately US$72.50 per barrel as a baseline, this conversion provides a more tangible and easily understandable representation of the financial implications for consumers and the broader economy.
The color-coding of the lines in the fan is also strategically employed. Instead of a simple gradient from lowest to highest elasticity, the colors are designed to highlight the distance from the midpoint of the assumed elasticity range (0.1 to 0.2). This approach draws attention to the uncertainty and potential variability around the central estimate, rather than merely presenting a spectrum of outcomes.
Furthermore, the line plot allows for direct interpretation of current market conditions. By observing the current level of crude exports from the Gulf and tracing up to the fan of lines, analysts and observers can infer the implied price elasticity of demand at play, or identify any additional price premium being factored into the market due to other factors such as inventory levels, perceived geopolitical risk, or anticipated future supply and demand shifts.
Inferred Market Sentiment
The analysis of current plausible values within this framework suggests that current oil prices may be incorporating a slight additional premium beyond what is solely explained by immediate supply disruptions and the estimated price elasticity of demand. The presumption is that this premium likely reflects a market anticipation of potential future drops in exports from their current relatively robust levels, even if such fears are not yet fully materialized.
Background Context and Timeline of Events
The US-Iran conflict has been a persistent feature of Middle Eastern geopolitics for decades. However, the period from March 2026 onwards saw a significant escalation of tensions, marked by specific incidents that directly threatened maritime trade routes and oil infrastructure in the Persian Gulf. These events included, but were not limited to, [Insert specific hypothetical or real events here if available, e.g., naval skirmishes, drone attacks on oil facilities, sanctions intensification]. Each of these incidents, whether directly causing immediate supply cuts or increasing perceived risk, contributed to market volatility and influenced crude oil prices. The original diagram’s emergence in March 2026 likely coincided with a period of heightened concern following such events.
Broader Impact and Implications
The volatility in crude oil prices stemming from geopolitical conflicts has far-reaching implications:
- Global Economic Stability: Oil is a fundamental commodity underpinning global economic activity. Significant price surges can lead to increased inflation, reduced consumer spending, and slower economic growth worldwide.
- Energy Security: Nations heavily reliant on oil imports face increased risks to their energy security. Diversification of energy sources and strategic reserve management become paramount.
- Geopolitical Leverage: For oil-producing nations, fluctuations in oil prices can translate into significant geopolitical leverage, influencing international relations and domestic economic policies.
- Energy Transition: Sustained periods of high oil prices can accelerate the transition towards renewable energy sources as the economic incentive for alternatives increases. Conversely, sharp price drops can sometimes slow investment in green technologies.
Official Responses and Market Reactions
Governments and international bodies closely monitor these price fluctuations. In response to significant price spikes or supply disruptions, governments may consider releasing oil from strategic reserves, engaging in diplomatic efforts to de-escalate tensions, or implementing domestic measures to cushion the impact on consumers. Market participants, including major oil companies, financial institutions, and individual investors, react by adjusting their trading strategies, hedging positions, and investment portfolios. Statements from organizations like OPEC+ and major energy ministries often provide insights into their assessments of the market and potential policy interventions.
Conclusion
The re-examination and visualization of the theoretical impacts of the US-Iran conflict on crude oil prices underscore the critical role of clear data presentation in understanding complex economic phenomena. While the original analysis by Robin J Brooks and Haver Analytics laid important groundwork, the challenges in interpreting its 3D perspective plot highlight the need for more accessible graphical representations. The development of improved heatmap and, most notably, line plot visualizations reveals the direct and significant relationship between oil export volumes and price changes, while effectively communicating the uncertainty associated with price elasticity. In an era of persistent geopolitical volatility, such data-driven insights are indispensable for navigating the intricacies of the global energy market and its profound impact on the world economy.