
A significant advancement in geospatial data visualization has emerged with the development of a new function designed to automatically center map projections on the specific region of interest. This innovative tool, developed by the team at modTools and shared through their platform and the R-bloggers community, aims to minimize visual distortion inherent in traditional map projections, thereby enhancing the accuracy and clarity of plotted data. The function leverages the robust capabilities of the R package terra, a powerful library for handling raster and vector geospatial data.
This development follows closely on the heels of prior discussions and research, including a detailed post on modTools regarding the centering of map projections and a concurrent conversation on the Mastodon social network. The need for such a tool arises from the inherent challenges of representing a spherical Earth on a two-dimensional surface. Map projections are mathematical transformations that translate geographic coordinates into Cartesian coordinates, but each projection inevitably introduces some form of distortion, whether it be in area, shape, distance, or direction. The choice of projection and its orientation significantly impacts the visual representation of data, and for localized studies, a projection optimized for that specific area can dramatically improve interpretability.
The new function, tentatively named projectCentered by its creators, offers a streamlined approach to this complex problem. It allows users to input either a SpatRaster or SpatVector object, which are fundamental data structures within the terra package for representing gridded and vector geographic data, respectively. The function then automatically calculates the optimal central point for a chosen projection, ensuring that the area of focus is positioned at the heart of the projected map. This is particularly beneficial for projections like the Lambert Azimuthal Equal-Area, which is often used for regional studies where preserving area is critical. When centered correctly, the distortions introduced by the projection are minimized around the focal region, providing a more accurate visual representation of the data within that specific geographic context.
Background and Context
The creation of projectCentered is rooted in the ongoing efforts within the geospatial analysis community to improve the fidelity and utility of map visualizations. Traditional cartography has long grappled with the "flattening" of the globe. For centuries, cartographers have experimented with various projection techniques, each with its own strengths and weaknesses. For instance, the Mercator projection, widely used for navigation, famously preserves angles and shapes but severely distorts areas near the poles. Conversely, equal-area projections, while preserving the relative sizes of geographic features, can significantly distort shapes.
The advent of powerful statistical and visualization software, such as R and its associated geospatial packages, has democratized access to sophisticated mapping tools. However, achieving optimal projections for specific use cases often requires a deep understanding of projection mathematics and manual adjustments. The terra package, a successor to the widely-used sp package, provides a modern and efficient framework for handling these tasks. It offers advanced capabilities for raster and vector data manipulation, including reprojection.
The previous post on modTools, "Centering a Map Projection on the Mapped Region," likely explored the manual methods or underlying principles involved in achieving a centered projection. The subsequent discussion on Mastodon, a decentralized social network popular among academics and tech professionals, indicates a community-driven interest and a desire for a more automated and accessible solution. The development of projectCentered directly addresses this demand, abstracting away much of the manual calculation and setup that would typically be required.
Functionality and Use Case
The core innovation of projectCentered lies in its ability to automatically determine the optimal latitude and longitude for the center of a projection. This is crucial for azimuthal projections, which radiate outwards from a central point. By default, many geospatial software packages might project a dataset using a standard central meridian and parallel, which may not align with the geographic extent of the data being visualized. This can lead to the data being plotted off-center, potentially introducing greater distortion at the edges of the plotted area.
The function’s design prioritizes visualization. The developers explicitly state that while this tool enhances visual representation, for precise quantitative analysis, such as calculating areas or distances, it is generally recommended to work with unprojected data in a geographic coordinate system (like longitude and latitude in degrees) and utilize algorithms that account for the Earth’s curvature. This is a standard best practice in geospatial science, as projections, even optimized ones, are approximations.
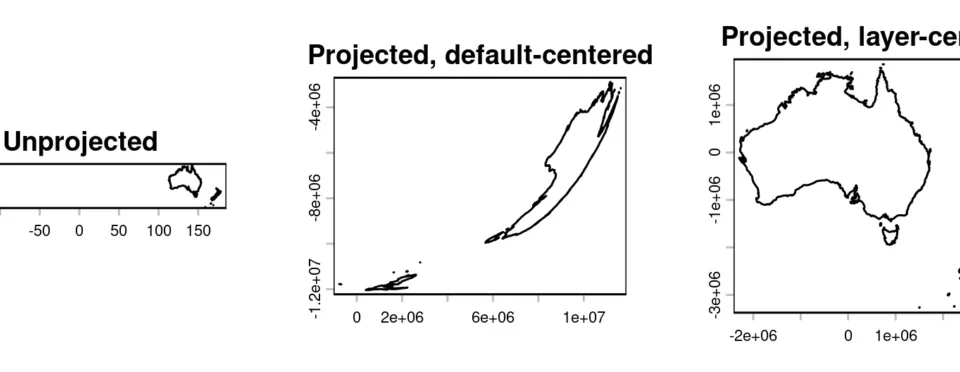
The provided example vividly illustrates the benefit of the projectCentered function. By comparing a map generated with the default projection behavior against one using the new function, the improvement is immediately apparent. The default projection, likely centered on a global or continental scale, shows the target region with noticeable distortion, especially at its peripheries. In contrast, the map produced by projectCentered exhibits a much more balanced representation, with the primary area of interest appearing more accurately shaped and proportionally sized, thanks to the projection being specifically tailored to its geographic extent. This is especially noticeable with projections like Lambert Azimuthal Equal-Area, where the goal is to maintain accurate area representation, and a well-chosen center point is paramount.

Supporting Data and Technical Details
While the article does not delve into the specific algorithms used by projectCentered, it is reasonable to infer that the function likely calculates the centroid or a weighted center of the input SpatRaster or SpatVector geometry. This centroid would then be used as the central latitude and longitude for the target projection. The terra package provides functions for calculating such geometric properties, including bounding box extents and centroids, which would be essential components for this process.
The terra package is known for its efficiency and modern API, designed to handle large datasets. Its integration with R allows for seamless integration into existing data analysis workflows. The function’s reliance on terra suggests it is built upon a solid and well-maintained foundation of geospatial processing capabilities. The ability to handle both raster (gridded data like satellite imagery or elevation models) and vector (point, line, or polygon data like administrative boundaries or feature locations) formats makes projectCentered a versatile tool for a wide range of applications.
Potential Applications and Broader Impact
The implications of this development are far-reaching for anyone working with geospatial data. Researchers studying specific ecological zones, urban planners analyzing city-wide development, geologists investigating mineral deposits in a particular region, or even social scientists mapping population distributions within a defined area, can all benefit from more accurate and visually intuitive maps.
For instance, an ecologist studying a specific forest ecosystem might find that a standard projection distorts the relative sizes of different habitat types within that forest. By using projectCentered, they could generate a map where these habitat areas are represented more faithfully, leading to better-informed conservation strategies. Similarly, an urban planner could use this function to visualize proposed infrastructure projects within a city, ensuring that the scale and spatial relationships of different urban components are accurately depicted, aiding in public consultation and decision-making.
The developers’ note that maps can be made to look much nicer even with just terra and base R plots, without additional dependencies, is a testament to the power and flexibility of these tools. This suggests that while projectCentered is a specialized function, it can be readily integrated into broader mapping workflows, allowing for the creation of publication-quality figures with minimal external requirements.
Future Directions and Community Engagement
The open sharing of this function through platforms like modTools and R-bloggers signifies a commitment to community collaboration and the advancement of open-source geospatial tools. The mention of reporting issues on the R-bloggers contact page highlights a dedication to ongoing improvement and user support.
While this function is primarily for visualization, its success could pave the way for further research into automated projection optimization for analytical purposes. The R community, known for its rapid innovation, may see further developments building upon this concept, potentially leading to more sophisticated tools for quantitative geospatial analysis.
In conclusion, the development of the projectCentered function represents a valuable contribution to the field of geospatial data visualization. By automating the process of centering map projections, it empowers users to create more accurate, less distorted, and more interpretable maps, ultimately enhancing our understanding of spatial phenomena. This innovation underscores the dynamic nature of geospatial technology and the power of open-source development in driving progress.